Trying to picture funny elements doesn't make sense:
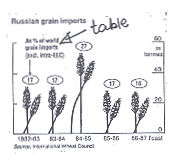
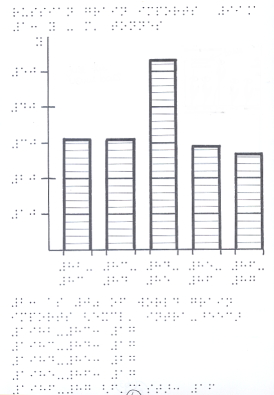
render charts uniform.
Note the helpful line hatching within the bars.
Actually, almost all charts are easier to read as tables in text;
but we have to give the blind reader an idea what charts are like.
braille picture ¼ size
| |
|
go to first page, previous page or next page
© 1989, 2002 Marco Schuffelen All Rights Reserved