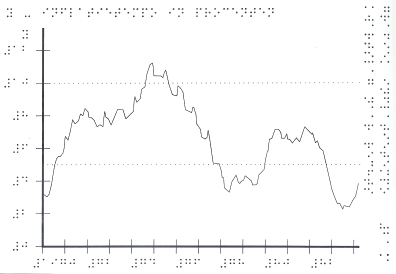
The yearly averages are given in a table. Usually, we draw the curve as a fat line, but in this particular case that would not show the wriggliness well.
Copyright © 1989-2002 Marco Schuffelen