Complicated Graph
braille picture ¼ size
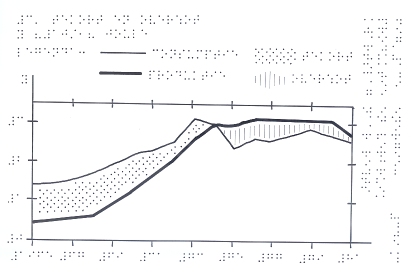
The complicated graph is split up, this is the third
of three standard graphs, all in the same template.
(The first two graphs show energy production and consumption
over the years
by type (coal, oil etc.),
the third shows the resulting shortage and surplus.)
Copyright © 1989-2002 Marco Schuffelen
home
Last modified: Sat Dec 29 13:40:44 PST 2001